// work / pitch deck design
Series A deck for a telehealth and chronic-care platform
A data-heavy Series A deck for a telehealth company, built to make cohort retention, clinical outcomes and the expansion story readable by non-medical investors.
- Client
- Telehealth and remote monitoring company
- Industry
- HealthTech
- Year
- 2025
- Role
- Narrative, data visualisation and deck design
- Duration
- 4 weeks

Context
A telehealth company combining video consultations with connected devices for chronic-care patients had strong clinical data and strong retention. Their Series A draft was 40 slides, most of them exported spreadsheet charts, and the clinical evidence was presented in the language of a medical paper. Generalist investors were not following it.
The problem
Keep the rigour, lose the jargon. Investors needed to see three things quickly: patients stay, outcomes improve, and the economics work per patient. The deck had all three buried in tables.
Approach
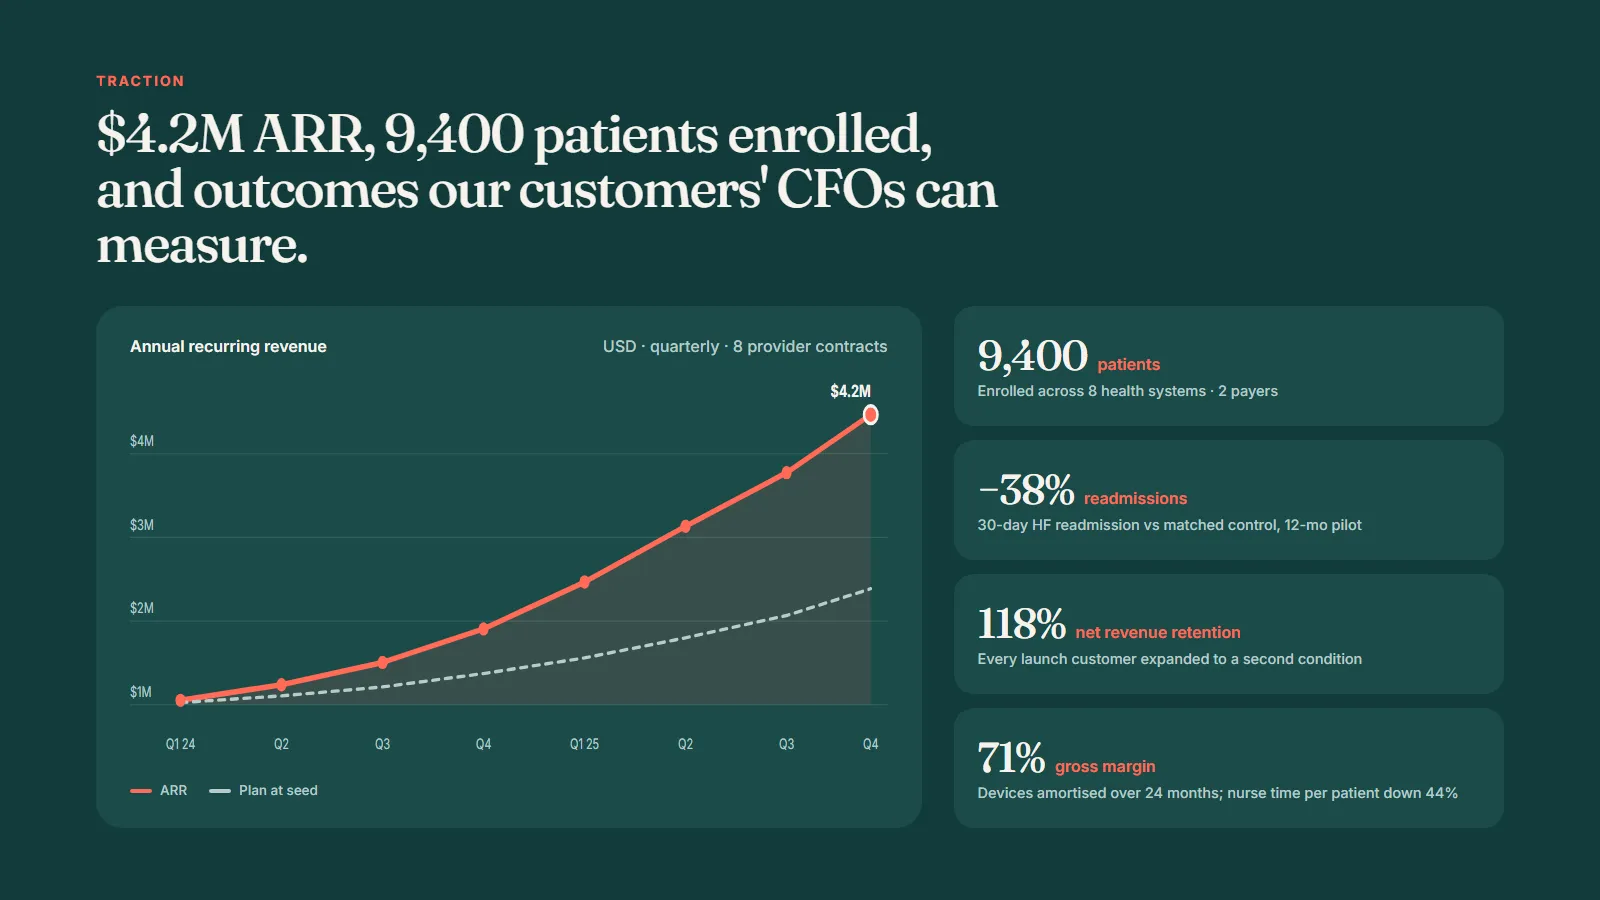
Find the one chart. The company’s cohort retention was unusually good. I rebuilt it as a single set of retention curves by quarterly cohort, with the industry benchmark drawn as a grey line underneath. That became the traction slide and the thing every investor asked about.
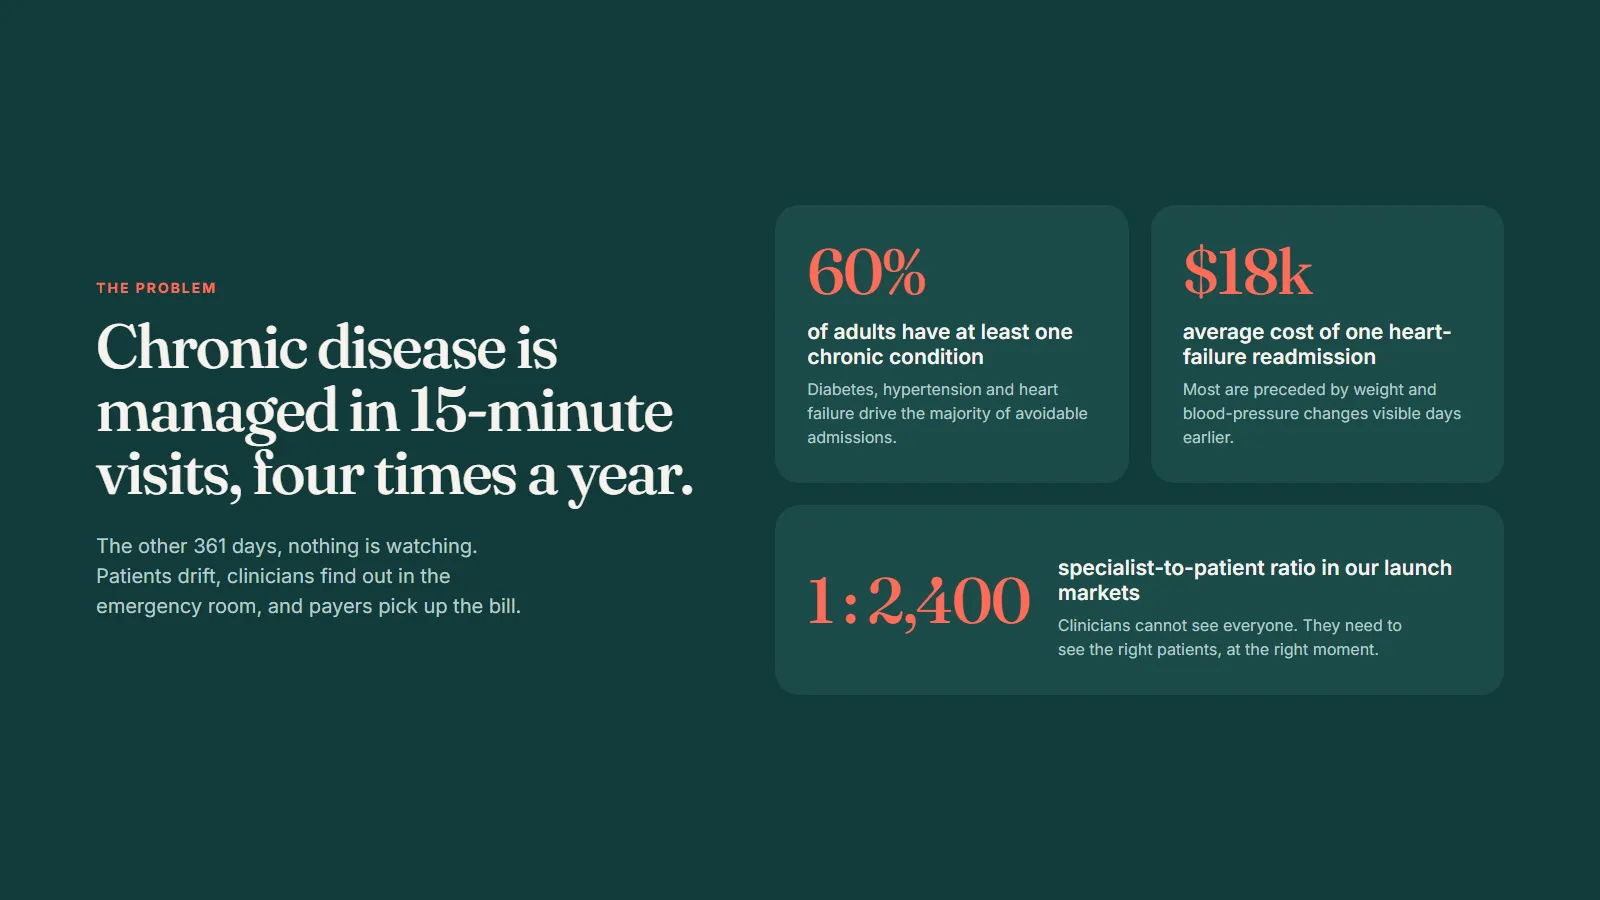
Translate the clinical story. Outcomes were reframed from clinical measures to their consequence: fewer emergency admissions per hundred patients, and what that saves a payer. The clinical detail moved to the appendix and the data room, where a specialist investor can check it.
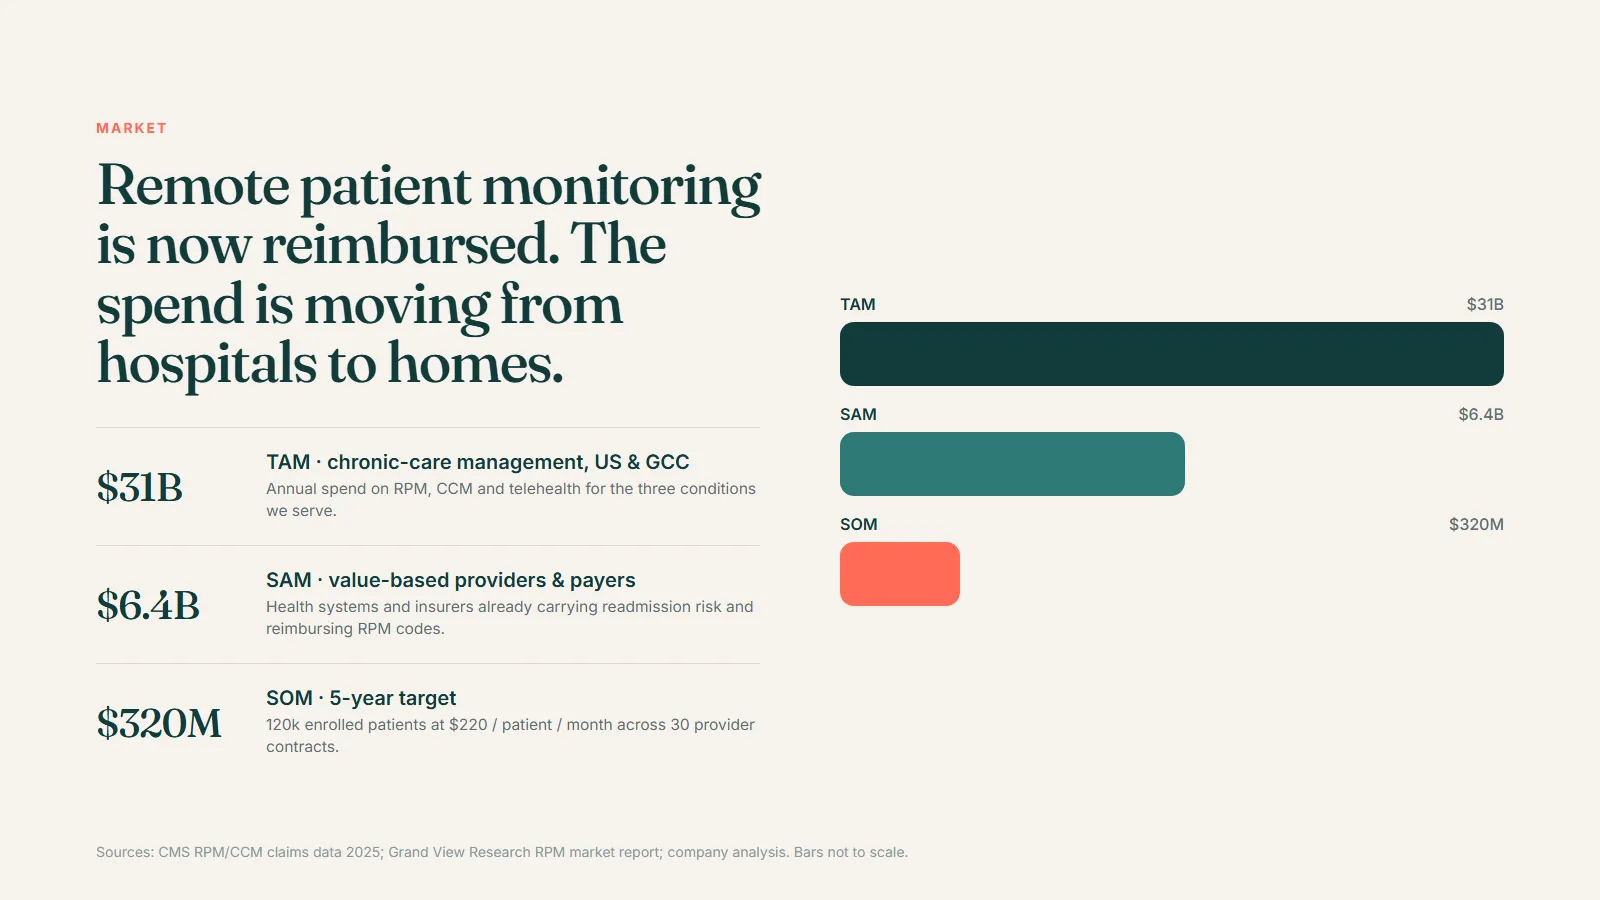
Size the market bottom-up. Number of eligible patients, the reimbursement per patient per month, the share reachable through the company’s existing provider partners. Every assumption is on the slide, which is the point: the number survives questioning.
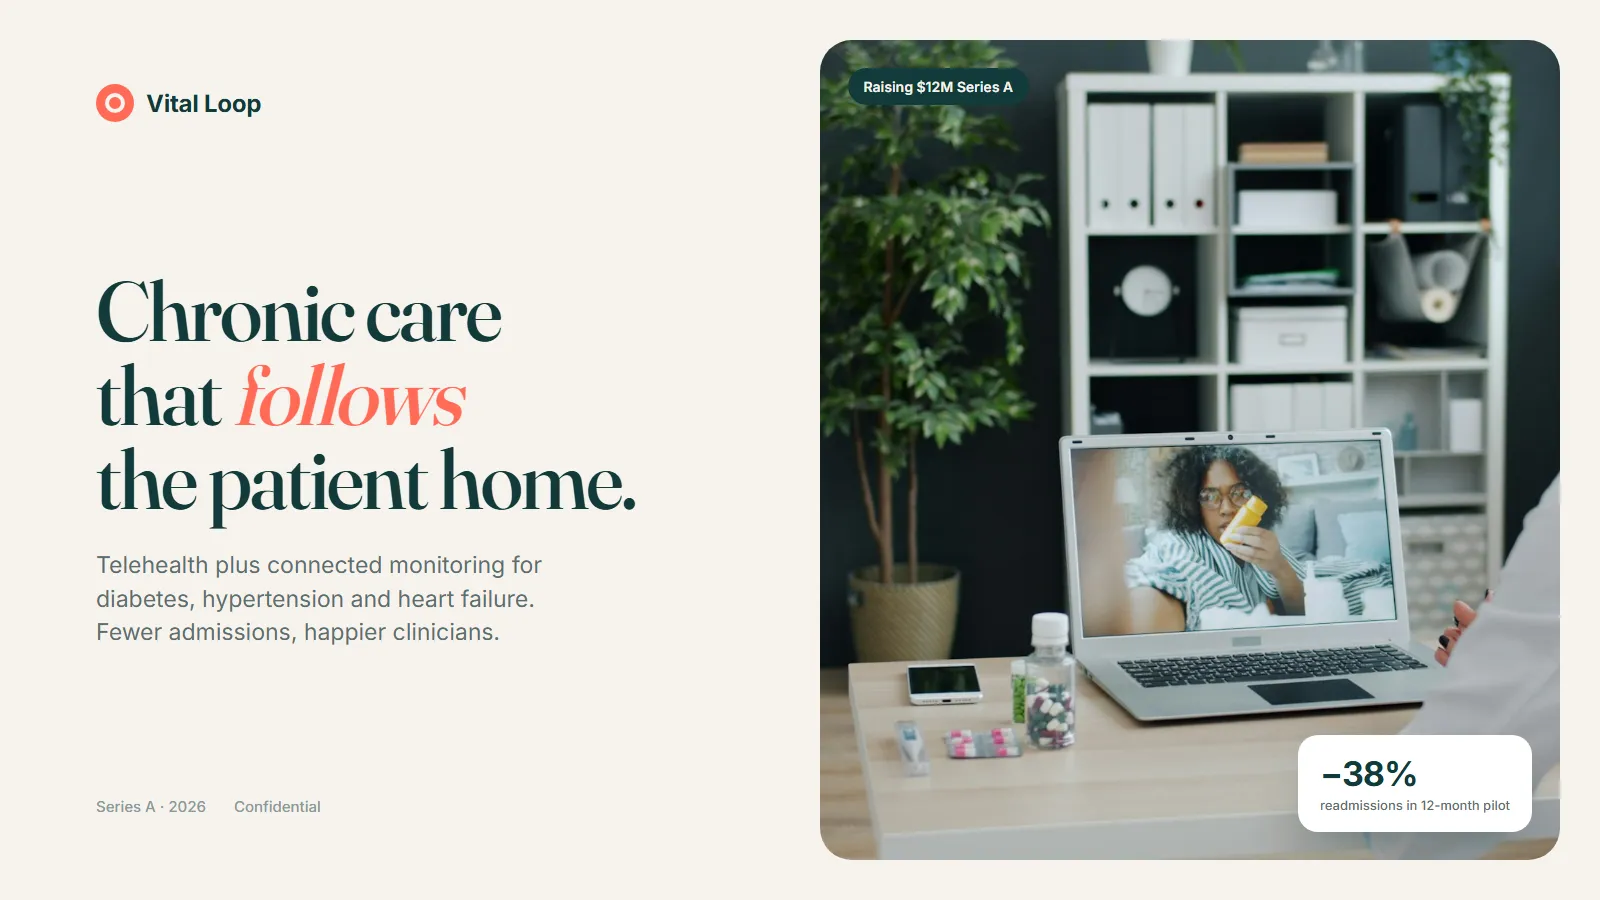
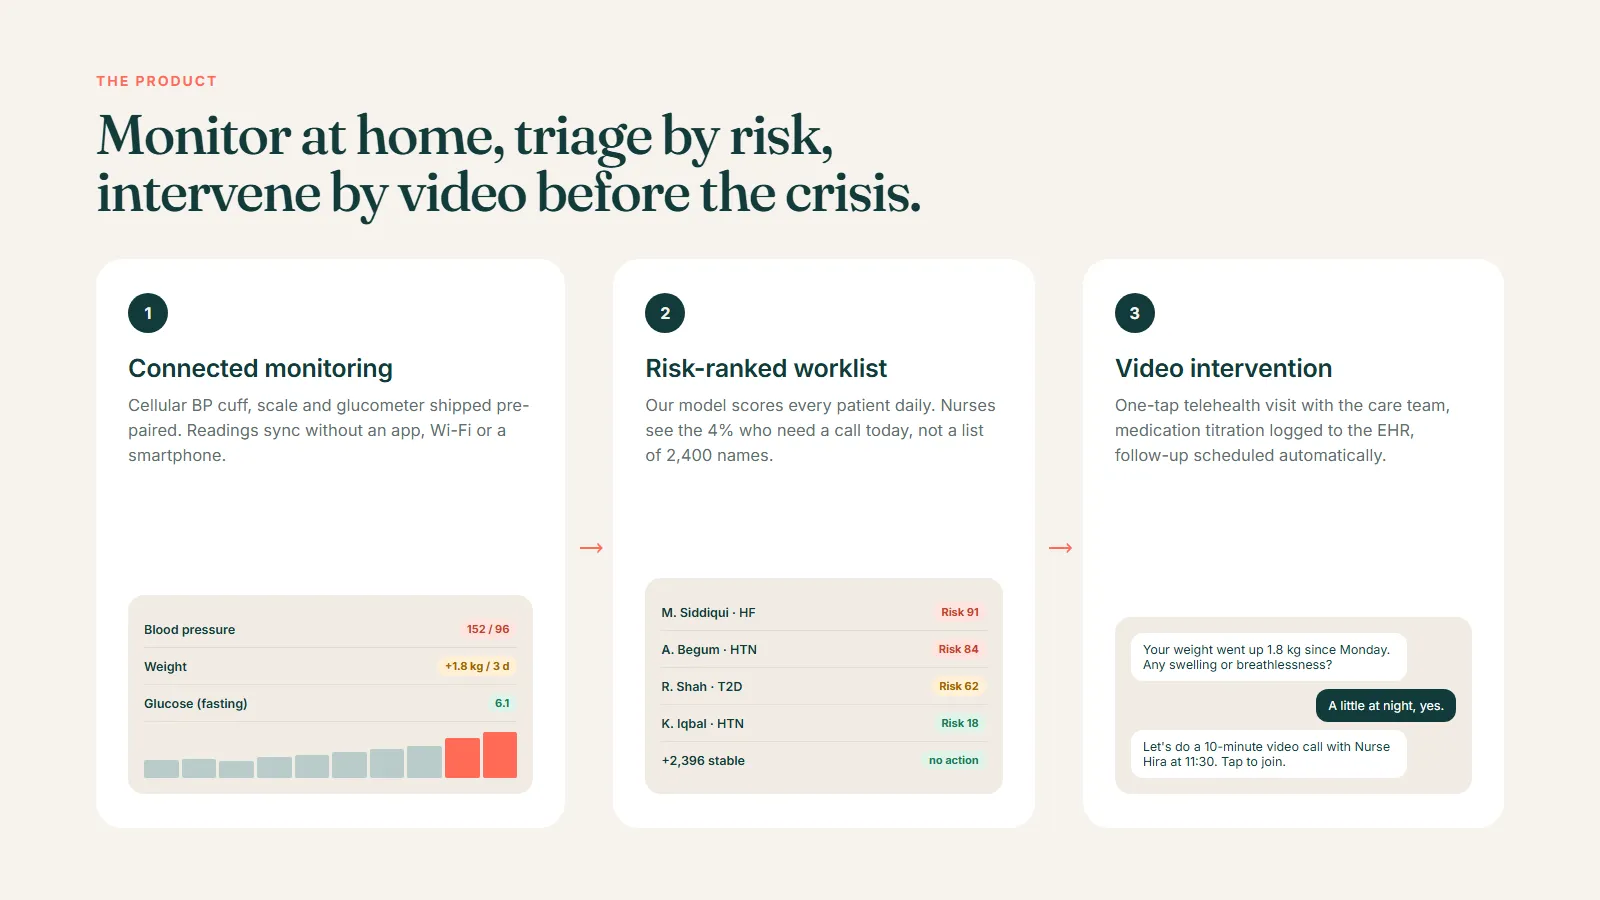
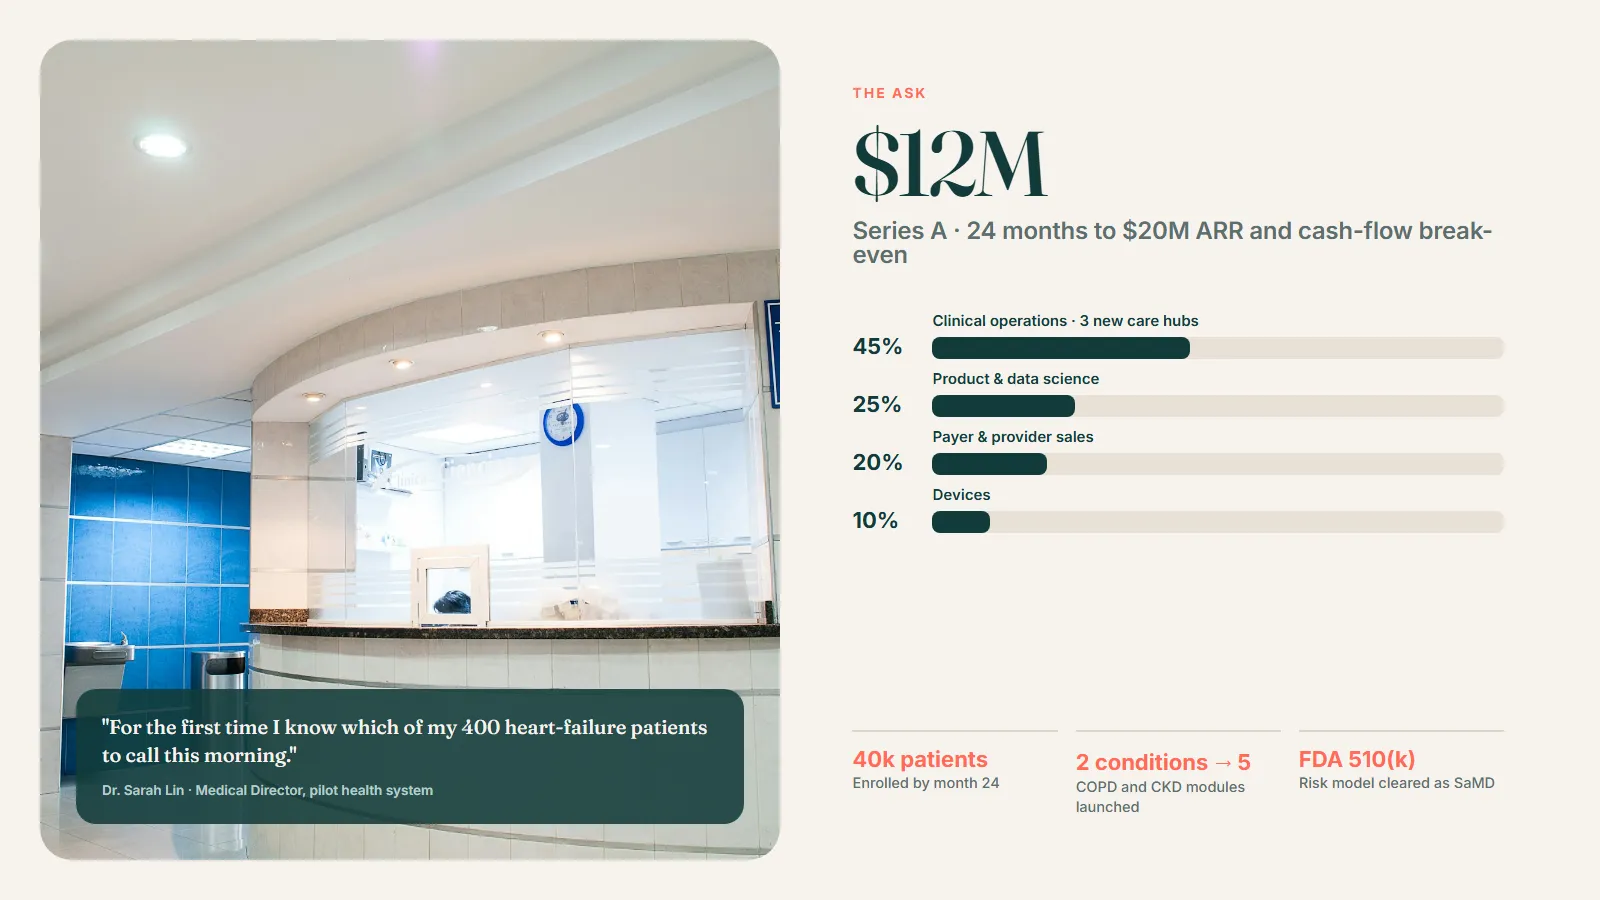
Design. A warm off-white, coral and dark teal palette to feel like healthcare rather than software, a single typeface and a chart style used consistently across all six data slides. Product screens shown in context on real devices.
Data room. The deck’s appendix slides index to a data room folder structure, so when an investor asks for the evidence behind a slide, the founder sends a link rather than compiling a document.
Outcome
Eighteen slides, six rebuilt charts, and a deck that leads with the retention curve. The founders reported that first meetings started going straight to the questions that matter for a Series A, namely expansion and unit economics, rather than to “explain the clinical part again”. The data room and deck share one index, which shortened diligence noticeably.